Why Your ASR Benchmark Isn't Telling You the Whole Truth
Automatic Speech Recognition (ASR) is increasingly embedded in production systems — from voice assistants to transcription services to hospitality copilots. When selecting a model, developers naturally reach for Word Error Rate (WER) as a reliable quality signal. But WER is not a fixed property of a model. It is a measurement, and like any measurement, it depends heavily on how it is taken.
The same model, run by different inference providers, can yield WER values that differ by more than six percentage points. The same model, evaluated on English versus German versus Swiss dialect speech, tells an entirely different story. Normalisation rules, quantisation levels, and decoding strategies all move the needle — sometimes silently. Trusting a single published benchmark without understanding these variables is a recipe for disappointment in production.
This post unpacks the sources of that variation. We run controlled experiments using CASABLANCA's in-house evaluation framework EVADE across seven state-of-the-art ASR models, with a deliberate focus on German, Austrian, and Swiss dialectal speech — a notoriously underrepresented and challenging evaluation target. The goal is to give practitioners a clearer picture of what benchmark numbers actually measure, and what to watch out for when evaluating ASR for a specific use case
ASR Metrics
Reported word error rates (WER) for the same automatic speech recognition (ASR) model can vary substantially. Artificial Analysis (AA), for example, reports provider-dependent differences of more than five percentage points, as shown in Table 1. Its centralized measurements also differ from values published by model developers in their technical reports, while custom evaluation procedures produce further variation
This blog post investigates the sources of these inconsistencies. We examine how inference configurations and evaluation data affect measured performance, using experiments on strongly accented and dialectal speech from Germany, Austria, and Switzerland. Based on these findings, we discuss practical recommendations for evaluating state-of-the-art ASR models for specific use cases.
ASR Models
Many SOTA ASR models use transformer-based architectures. First, a speech sample is encoded into a sequence of acoustic representations by an audio encoder. The model then processes these representations and predicts a sequence of text tokens. Finally, a decoding procedure converts the text tokens into a transcription. An illustration of this process is shown in Figure 1. ASR models differ in their architecture, model size, audio representation, and decoding strategy.

As of July 2026, AA includes 66 ASR models from 25 providers in its evaluation. The evaluations presented in this blog post cover seven models from different developers and across a range of model sizes, as shown in Table 2.
This post distinguishes between model developers and inference providers. Model developers create models and make their weights available for public or commercial use, whereas inference providers operate the infrastructure required to run these models. These roles are not mutually exclusive, as an organisation may both develop and host a model. For example, NVIDIA developed Parakeet TDT 0.6B V3, while Together AI offers the model as a hosted inference service.
ASR model performance can be assessed across three main dimensions: accuracy, speed, and cost. These dimensions involve practical trade-offs, as improvements in accuracy may require slower or more expensive inference. Each dimension can be quantified using one or more metrics.
1. Accuracy
Transcription accuracy is quantified by the WER: the number of mistranscribed (substitution), missed (deletion), and wrongly added (insertion) words divided by the total number of words in the reference transcription.
S, D, and I denote the number of substitutions, deletions, and insertions respectively, while N is the total number of words in the reference transcription. A lower WER indicates higher accuracy. ASR models that achieve a WER of less than 10% may still perform substantially worse on edge cases such as low-quality audio, rare languages, or dialects. Accuracy can also be influenced by model architecture, model size, training data, preprocessing, decoding strategy, and numerical precision.
2. Speed
ASR processing speed can be quantified using two related metrics. The real-time factor (RTF) is the ratio of processing time to input audio duration:
For example, if a model processes one second of audio in 100 ms, its RTF is:
An RTF below 1 indicates that the model can process audio faster than real time. Lower RTF values therefore indicate faster processing.
The speed factor, used by AA, is the reciprocal of RTF and measures how many seconds of audio can be processed per second:
In the previous example, an RTF of 0.1 corresponds to a speed factor of 10. Higher speed factors indicate faster processing. Inference speed depends on factors including audio duration, model size, hardware, numerical precision, batch size, and implementation optimizations.
3. Cost
ASR inference costs depend on the deployment model and billing method. Hosted ASR services are commonly priced by input audio duration, for example in euros per audio minute or hour. Some multimodal APIs instead calculate costs from the number of input and output tokens.
For self-hosted models, the direct inference cost can be estimated from the processing time and hourly hardware cost:
To enable comparisons across datasets and billing models, this blog post reports cost in euros per inference. The resulting cost depends on factors including the inference provider, hardware, processing speed, model size, numerical precision, batch size, and hardware utilization. Self-hosting an open-weight model may reduce unit costs at sufficient scale, but it also introduces infrastructure, maintenance, and engineering costs.
Accuracy Differences
Table 3 shows differences in reported WER that exceed seven percentage points in some cases. This section examines the factors that may account for this variation. It distinguishes between evaluation-specific factors — such as dataset composition, reference quality, and text normalisation — and implementation-specific factors, such as preprocessing, numerical precision, and decoding strategy. The experiments were conducted using Casablanca's in-house AI evaluation framework EVADE and a subset of the German VoxForge dataset containing 1,000 samples.
The typical evaluation dataset for ASR models includes audio samples and their respective reference transcriptions. The final WER can be calculated by either aggregating the WERs of all samples — which assigns equal weight to samples of different lengths — or by calculating the corpus-level WER described in Formula 6.
EVADE reports the unweighted mean of the WERs calculated for individual samples. The WER strongly depends on the language of the evaluation dataset. German audio samples are generally less well represented in ASR training corpora than English, which may impact transcription accuracy. The majority of SOTA ASR models support multiple languages and can automatically detect the transcription language. English, Chinese, French, German, Russian, Spanish, and Italian are among the most commonly supported. Although many SOTA ASR models report relatively low WERs for these languages, substantially higher WERs are often reported for less widely represented languages — as noted by NVIDIA, Mistral, and OpenAI.
ASR models are also sensitive to audio quality. Poor quality may result not only from distortions or noise, but also from low sampling frequencies — a phone assistant, for example, can be limited to 8 kHz narrowband telephony. The model documentation for NVIDIA's Parakeet V3 reports a clear relationship between signal-to-noise ratio (SNR) and increased WER.
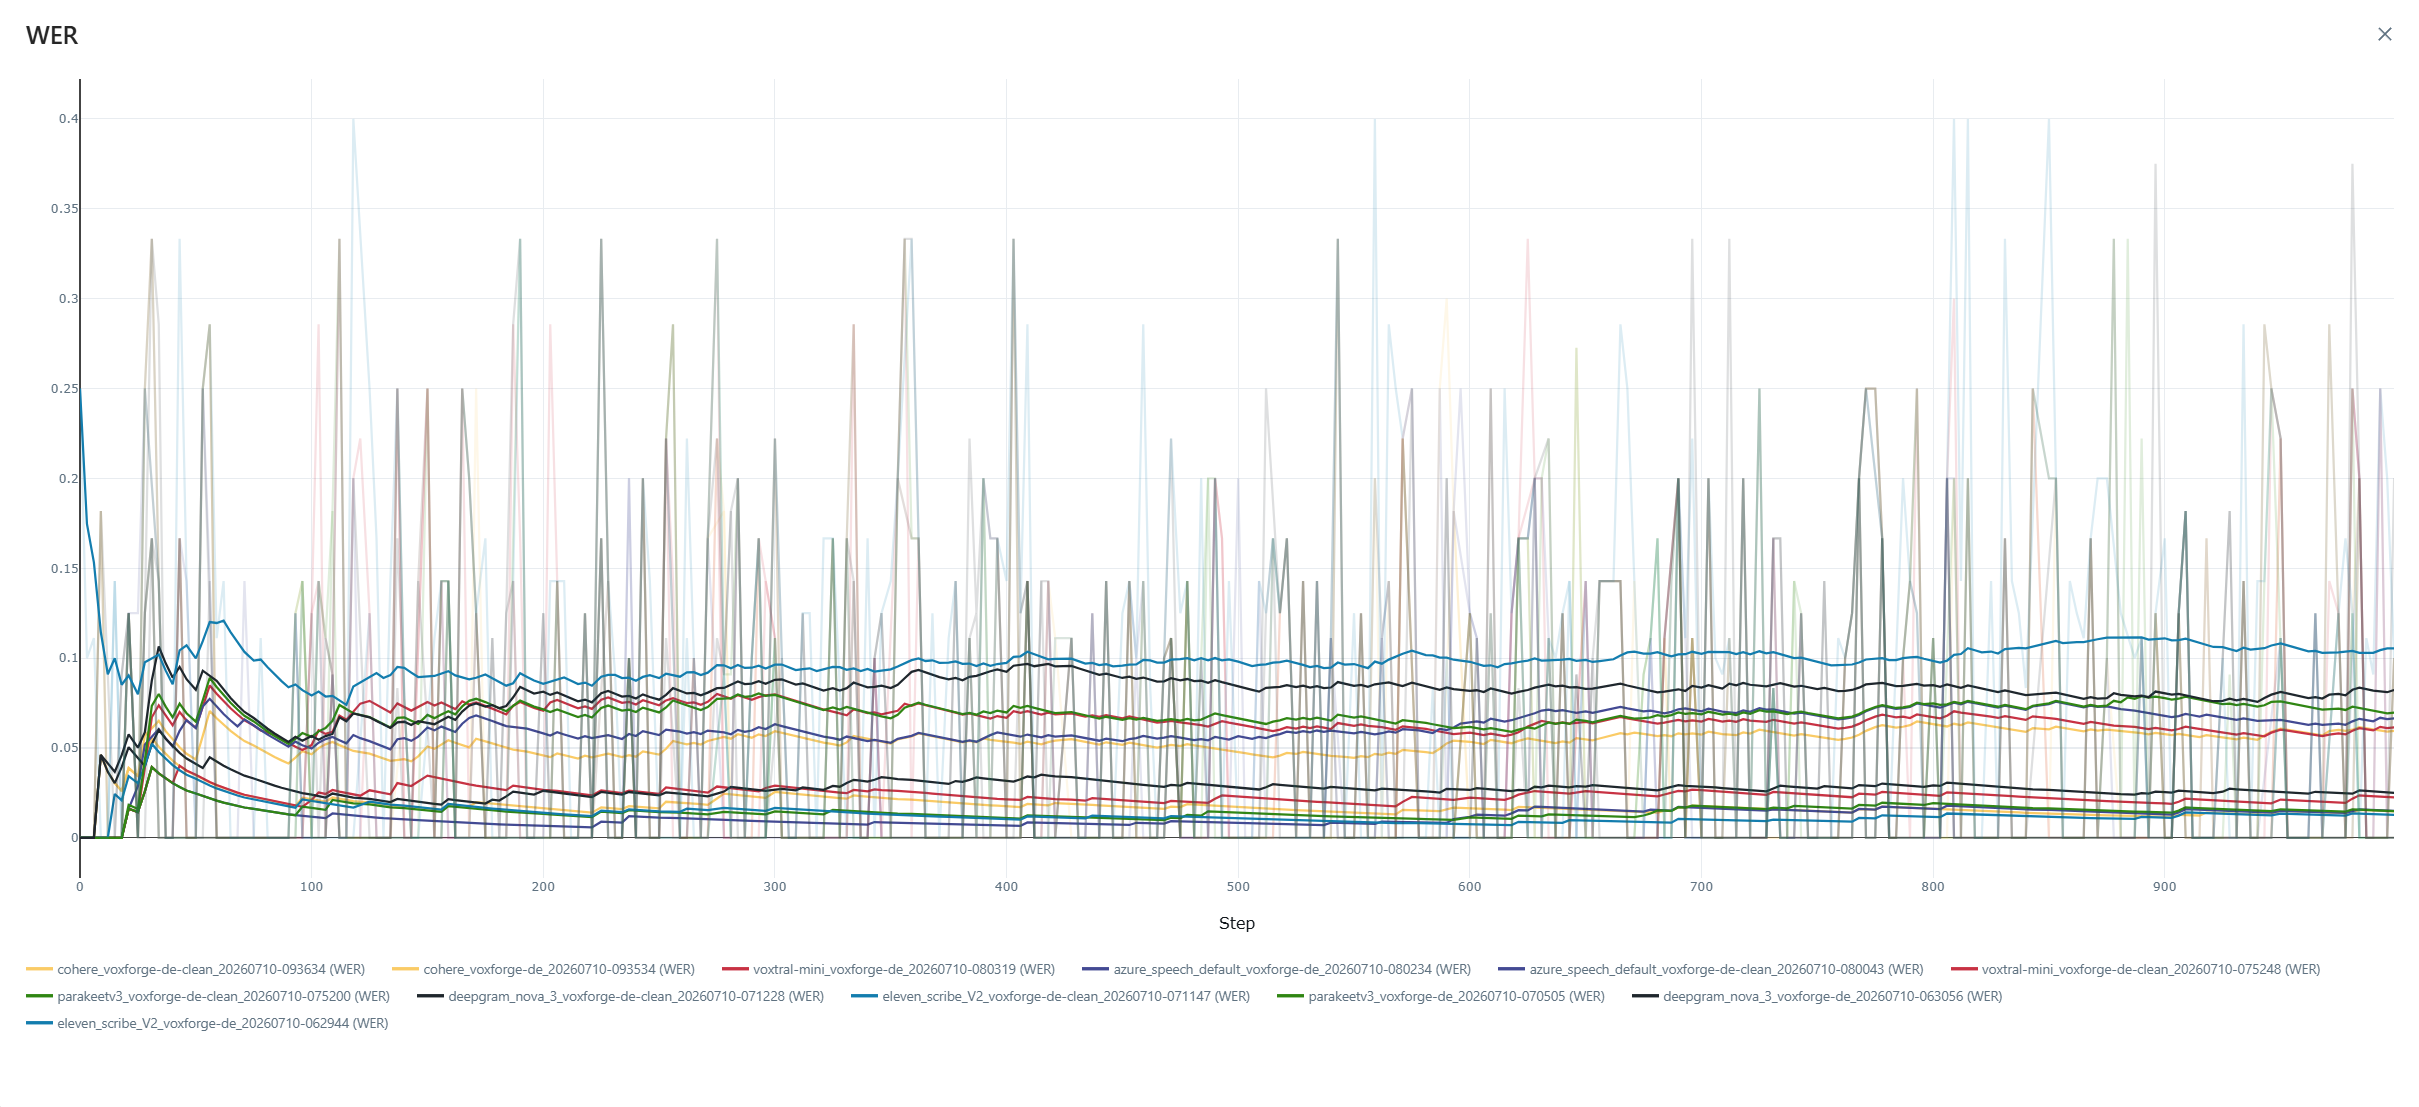
Finally, text normalisation can be applied to reduce the WER. For the experiments in this post, removing punctuation was sufficient to reduce WER by up to five percentage points, as shown in Figure 2. An article by AA describes a similar mechanism. These evaluation-specific factors can explain differences between benchmark results obtained using different datasets and evaluation procedures. However, they cannot explain why inference providers produce different results when evaluated under the same external protocol.
To explain provider-specific WER differences, implementation-specific influence factors must be examined. The key factors influencing the output quality of an ASR model are the input, the decoding strategy, the preprocessing, the model weights, the runtime optimisation, and the inference resources.
The input is consistent across all inference providers, as it is supplied by AA's evaluation dataset. Although model weights could differ between providers, this is ruled out as an obvious cause of quality variation. Input preprocessing converts audio into a processable representation; common techniques include normalisation, noise reduction, and voice activity detection (VAD). Preprocessing can have a strong positive or negative impact on model performance, and while inference providers rarely disclose these pipelines in detail, differences are plausible.
Inference resources should in theory not affect accuracy — they are primarily responsible for speed and cost. However, hardware constraints can influence implementation choices, which in turn may affect accuracy.
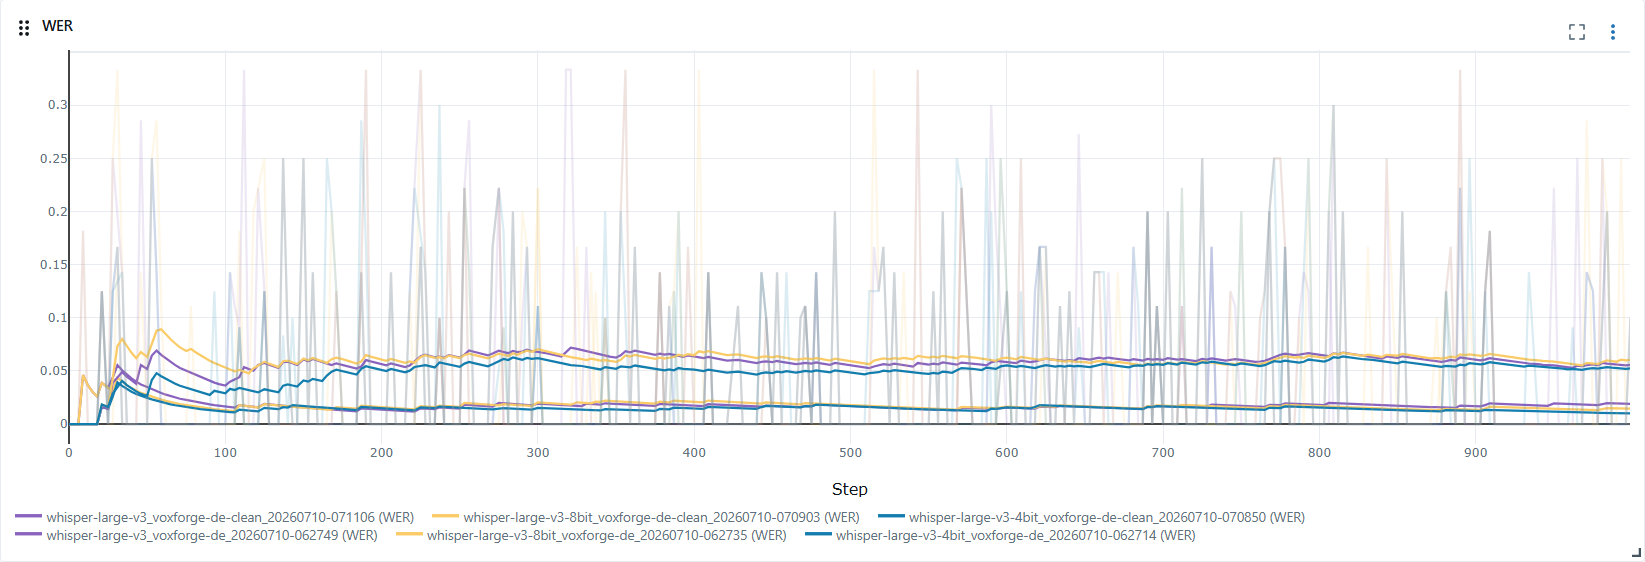
To explore whether model quantization impacts ASR accuracy, an experiment was conducted in EVADE for Whisper Large V3. The results shown in Figure 3 reveal subtle WER differences: higher quantisation (8-bit) tends to perform slightly better than lower quantisation. Lower-quantised models, however, show better speed and cost performance.
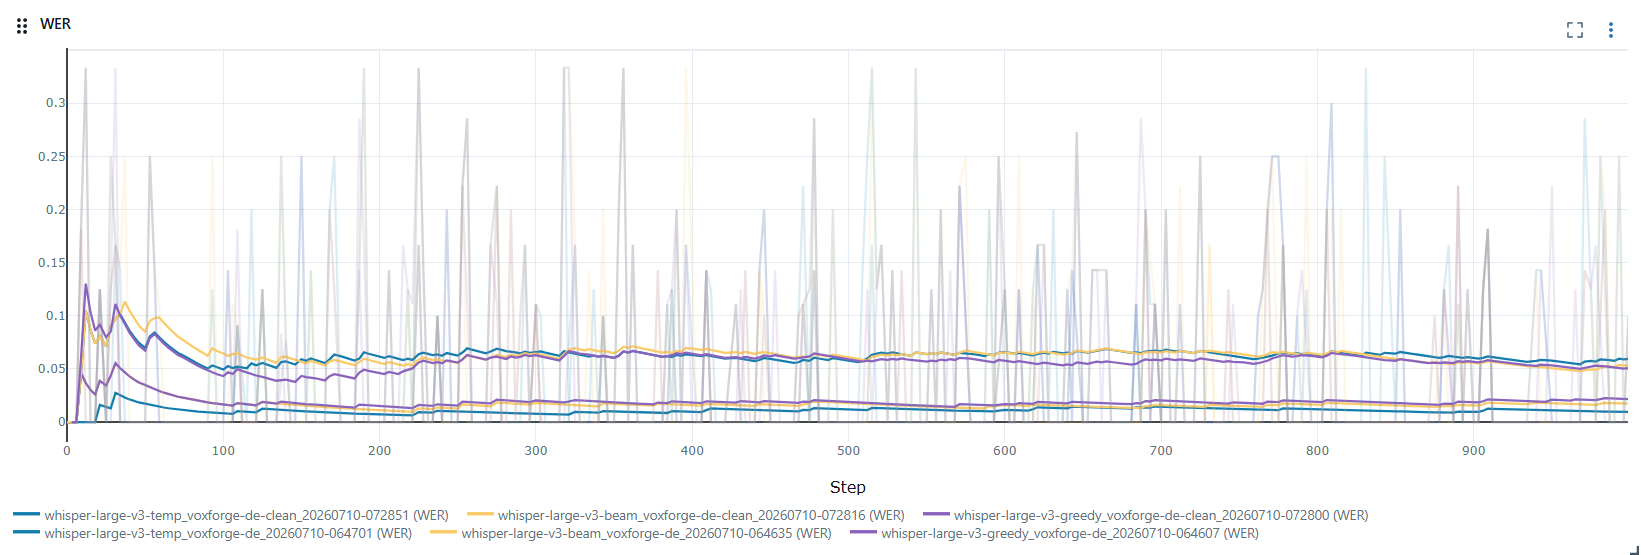
Decoding strategy can also influence the transcription. Greedy decoding selects the most probable token at each step, whereas beam search retains multiple candidate sequences and selects the one with the highest overall score. Temperature-based sampling adjusts the token probability distribution before sampling, introducing nondeterminism into the output. Figure 4 compares these strategies for Whisper Large V3 and shows only minor WER differences under the tested conditions.
Dialectal Speech
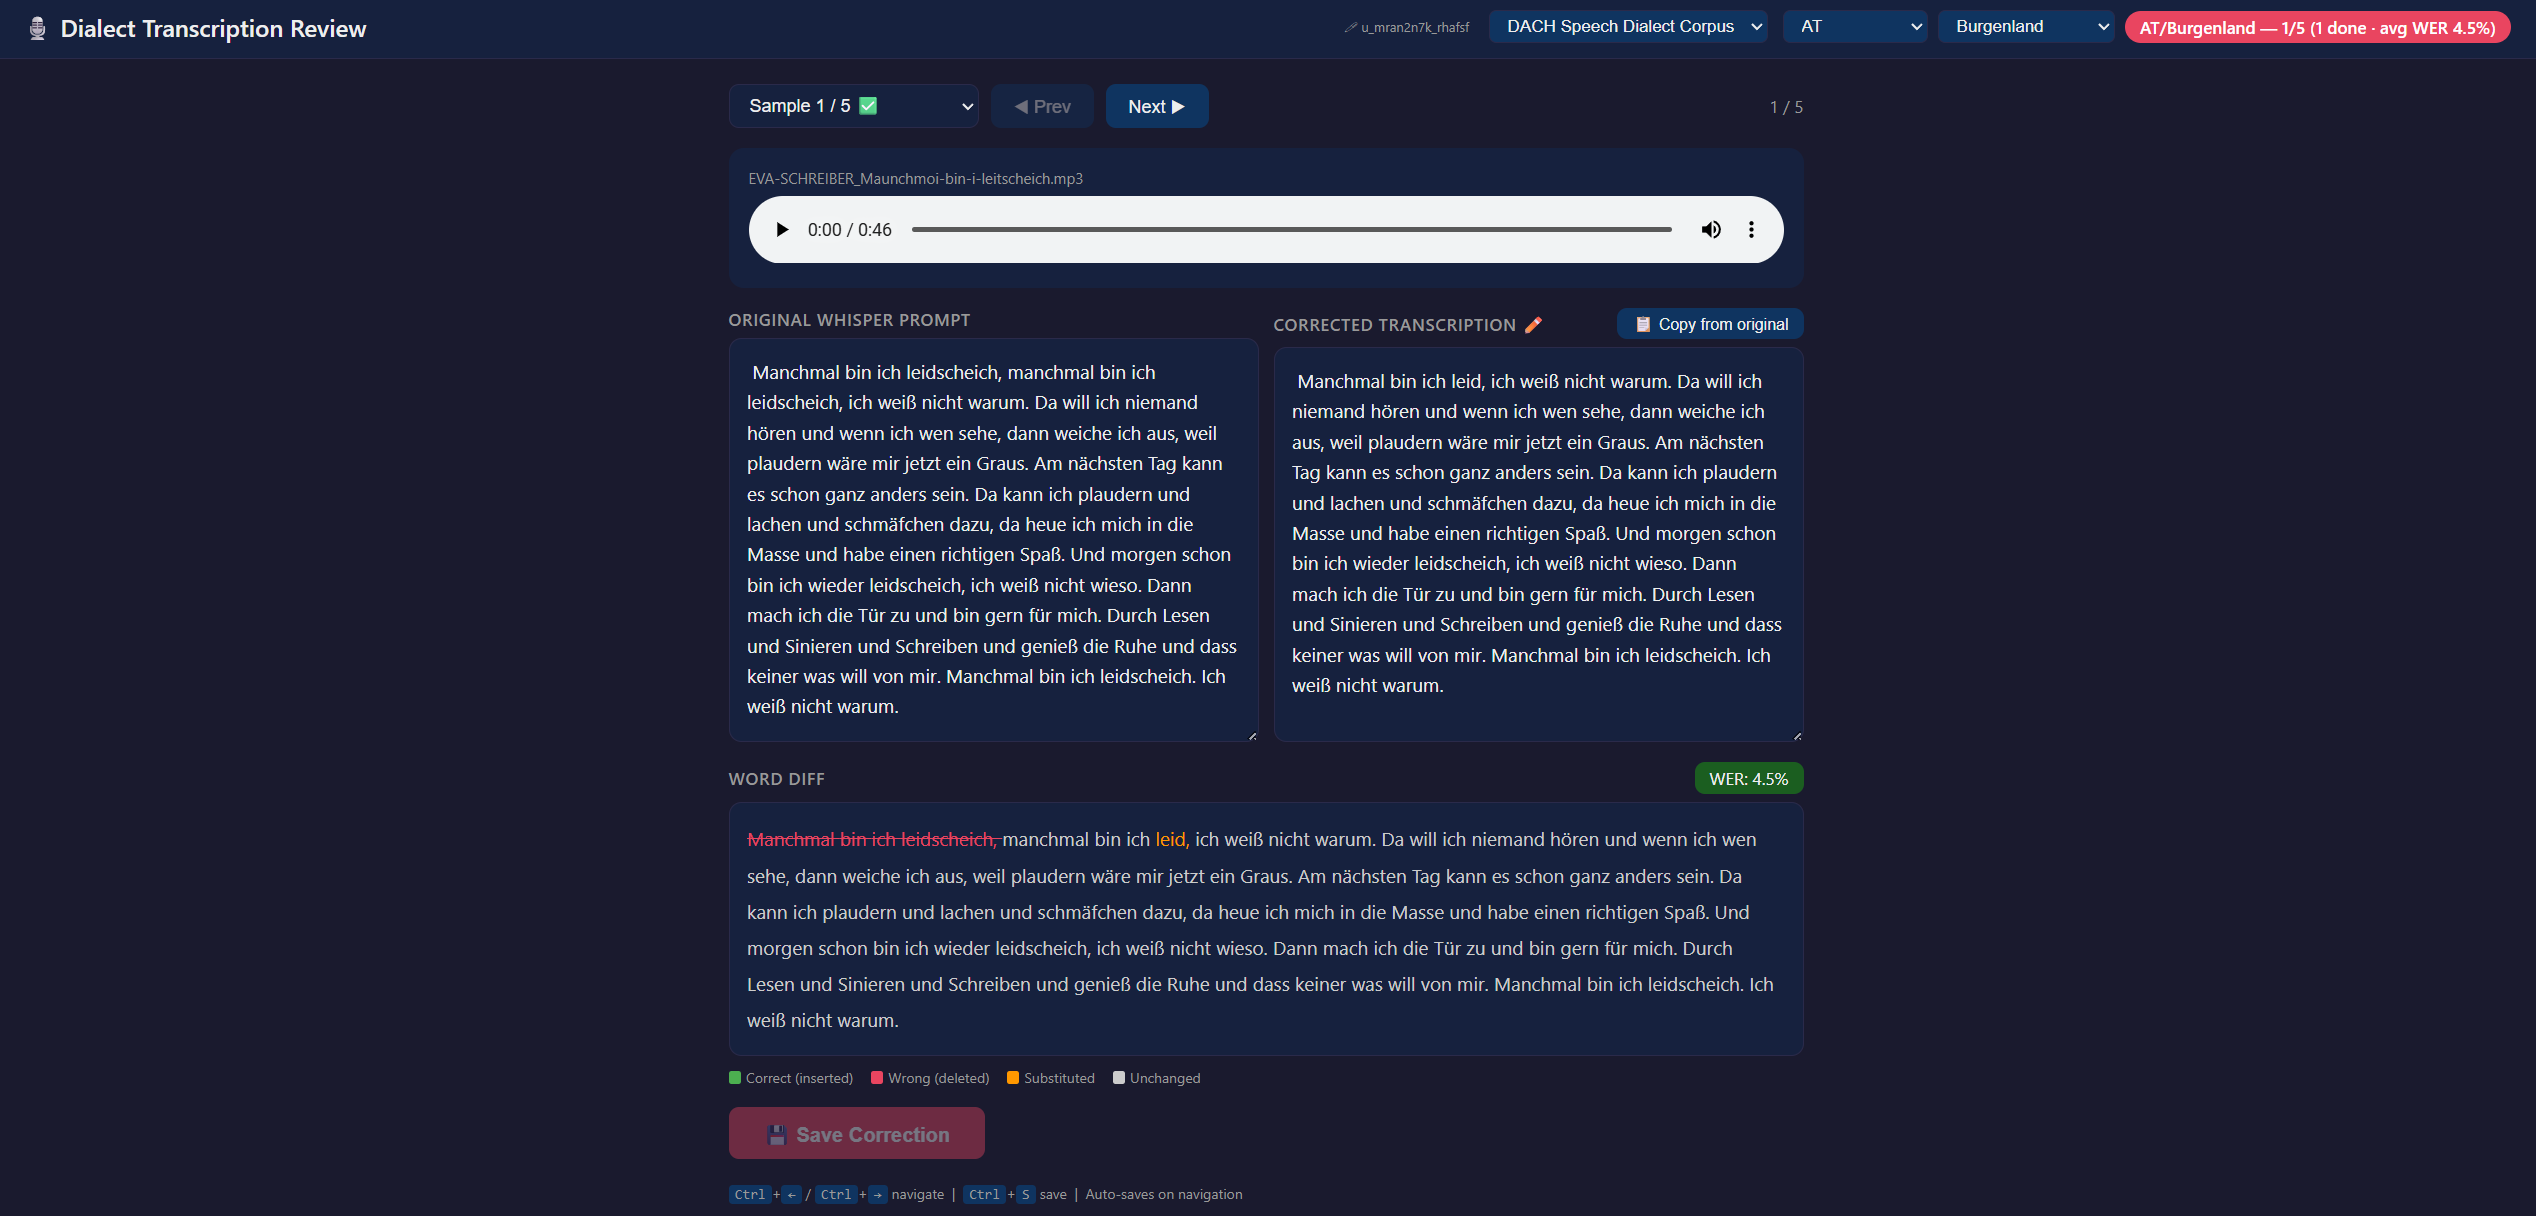
Dialectal speech is expected to cause a significant loss of transcription accuracy. To validate this claim, a small dialectal speech dataset covering every major dialect in the DACH region was obtained from public sources. The data distribution across dialects is visualised in Figure 5. To use this dataset for evaluation, the ground truth must first be annotated. A web application was therefore developed that allows locals to listen to audio samples in their dialect and submit transcription proposals. An initial suggestion is provided by Whisper Large V3. Figure 5 shows a screenshot of the annotation application
If you would like to contribute annotations in your dialect, you can start transcribing here.
Conclusion
This blog post examined why evaluations of the same ASR model can produce different WERs across benchmarks and inference providers. Using a subset of a public German speech dataset, the experiments showed that evaluation and implementation choices can change the measured WER by up to five percentage points. Text normalisation produced the largest observed change, whereas the tested quantisation levels and decoding strategies resulted in comparatively small differences.
These results demonstrate that WER values are meaningful only when the evaluation dataset, text-normalisation rules, model configuration, and inference implementation are fully reported. They do not fully explain the provider-specific differences reported by Artificial Analysis, as hosted services rarely disclose their exact model revisions, preprocessing pipelines, and decoding configurations.
A further objective is to evaluate ASR performance on strongly dialectal speech from the DACH region. Audio samples have been collected from public sources, but reliable evaluation requires human-verified reference transcriptions. Speakers familiar with the represented dialects can contribute annotations here.